 微信公众号


Colorectal tumor-induced orexigenic imbalance lowers protein appetite and drives early organ wasting symptoms
Afroditi Petsakou et al.
Abstract
Cancer cachexia (CC) is a deadly syndrome characterized by weight loss and wasting of muscle and adipose tissue1. Early symptoms include behavioral changes such as anorexia (loss of appetite) that precede weight loss and organ wasting2. Around ∼50-80% of patients with advanced cancer develop CC3, generating a pressing need to understand CC progression. Although recent advances have identified distinct metabolic, inflammatory, and neuronal networks associated with CC, the underlying mechanisms initiating early-stage CC remain unclear1. This outstanding question has proven difficult to answer in murine models due to the complexity and onset variability of CC. To address this, we utilized a fly colorectal-tumor model with a defined time-window for organ wasting4. We discovered that combined increase of conserved factors involved in inflammation (Upd3/Interleukin-6-like) and in reduced insulin signaling (ImpL2/Insulin Growth Factor Binding Protein) cause orexigenic dysfunction prior to organ wasting due to silencing of NPF (Neuropeptide F/ Neuropeptide Y) signaling in the brain. This initiates inadequate protein-specific nutritional choices and anorexia, promoting weight loss. Altogether, we provide evidence for an intricate mechanism that alters protein appetite and drives early organ wasting symptoms.
摘要
癌症恶病质是一种致命的综合征,其特征是体重减轻以及肌肉和脂肪组织消耗¹。早期症状包括行为改变,例如在体重减轻和器官消耗之前出现的厌食症(食欲不振)²。大约50-80%的晚期癌症患者会发生恶病质³,因此迫切需要了解其进展机制。尽管近期研究进展已识别出与癌症恶病质相关的不同代谢、炎症和神经元网络,但其早期阶段的起始机制仍不清楚¹。由于癌症恶病质的复杂性和发病变异性,这个关键问题在小鼠模型中难以解答。为解决此问题,我们利用了一个具有明确器官消耗时间窗的果蝇结直肠肿瘤模型⁴。我们发现,炎症相关保守因子(Upd3/类白细胞介素-6)和胰岛素信号减弱相关因子(ImpL2/胰岛素样生长因子结合蛋白)的联合增加,会导致大脑中NPF(神经肽F/神经肽Y)信号传导被抑制,从而在器官消耗之前引发食欲调节功能障碍。这启动了不适当的蛋白质特异性营养选择及厌食症,进而促进体重减轻。总之,我们为一个改变蛋白质食欲并驱动早期器官消耗症状的复杂机制提供了证据。
Activation of the Yorkie (Yki)/Yap oncogene in intestinal progenitor cells (using the escargot-Gal4 driver, together with the temperature-sensitive Gal4 repressor Tubulin-Gal80TS, referred as esgTS>ykiact) has emerged as an attractive adult-specific colorectal organ wasting model4–6. In this model, flies are reared until adulthood in low temperatures (18°C) to inhibit oncogene activation and then temperature is raised to 29°C (defined as day 0, d0) to allow colorectal Yki-tumor induction4. A week of Yki-tumor induction leads to the onset of organ wasting symptoms such as metabolic imbalance (increased lipolysis, reduced insulin signaling), bloating (ascites-like symptom) and reproductive organ atrophy, followed by fat cell degeneration and myofiber degradation4,7, reminiscent of colorectal CC symptoms. We reasoned that the short and well-defined time window prior to the onset of organ wasting makes this tumor model ideal for identifying early mechanisms linked to organ wasting initiation.
在肠道祖细胞中激活Yorkie (Yki)/Yap癌基因(使用esg-Gal4驱动子,配合温度敏感性Gal4抑制子Tubulin-Gal80TS,记为esgTS>ykiact)已成为一个有吸引力的、成虫特异性的结直肠器官消耗模型⁴–⁶。在该模型中,果蝇在低温(18°C)下饲养至成虫期以抑制癌基因激活,然后将温度升至29°C(定义为第0天,d0)以诱导结直肠Yki肿瘤⁴。Yki肿瘤诱导一周后,会出现器官消耗症状,如代谢失衡(脂肪分解增加、胰岛素信号减弱)、腹胀(腹水样症状)和生殖器官萎缩,随后是脂肪细胞变性和肌纤维降解⁴,⁷,这与结直肠癌恶病质症状相似。我们认为,该模型在器官消耗发作前具有短暂且明确的时间窗,是识别与器官消耗起始相关的早期机制的理想模型。
Previously, using a capillary-based assay it was observed that esgTS>ykiact flies had only a subtle decrease in food intake by d6 of tumor growth4. Since anorexia is an early symptom of CC, we reexamined food intake in esgTS>ykiactflies using a more sensitive approach. Specifically, we used an automated behavior apparatus (Flypad, Fly Proboscis and Activity Detector) that monitors in real time how long individual flies contact the food8. The duration of food contact (total duration of activity bouts) significantly correlates with food ingestion and is used to quantify feeding behavior8. Using the Flypad, we observed a significant reduction in the feeding behavior of individual male and female esgTS>ykiact flies (Fig. 1a). As the escargot-Gal4 driver is expressed subtly in the brain (Fig. 1b) in addition to the gut, which could complicate the interpretation of the results, we co-expressed the neuronal inhibitor elavGal80 to prevent oncogene activation in the brain (Fig 1b-c). Flies with ykiactoncogene expression specific to the gut and not the brain (elavGal80;esgTS>ykiact - hereafter referred as Ykiact), maintained significantly reduced feeding behavior (Fig 1d), indicating that anorexia-like behavior is due to colorectal tumor growth.
先前使用毛细管进食实验观察到,esgTS>ykiact果蝇在肿瘤生长第6天仅出现摄食量轻微下降⁴。由于厌食是癌症恶病质的早期症状,我们采用更灵敏的方法重新检测了esgTS>ykiact果蝇的摄食情况。具体而言,我们使用了一种自动化行为装置(Flypad,Fly Proboscis and Activity Detector),该装置能实时监测个体果蝇接触食物的时间⁸。食物接触持续时间(活动时段总时长)与食物摄入量显著相关,可用于量化进食行为⁸。使用Flypad,我们观察到个体雌性和雄性esgTS>ykiact果蝇的进食行为均显著减少(图1a)。由于esg-Gal4驱动子除肠道外在脑中也有微弱表达(图1b),这可能使结果解释复杂化,我们共表达了神经元抑制子elavGal80以阻止癌基因在脑中激活(图1b-c)。仅在肠道特异性表达ykiact癌基因而脑中不表达的果蝇(elavGal80;esgTS>ykiact——下文简称Ykiact),其进食行为仍显著减少(图1d),表明这种厌食样行为是由结直肠肿瘤生长引起的。
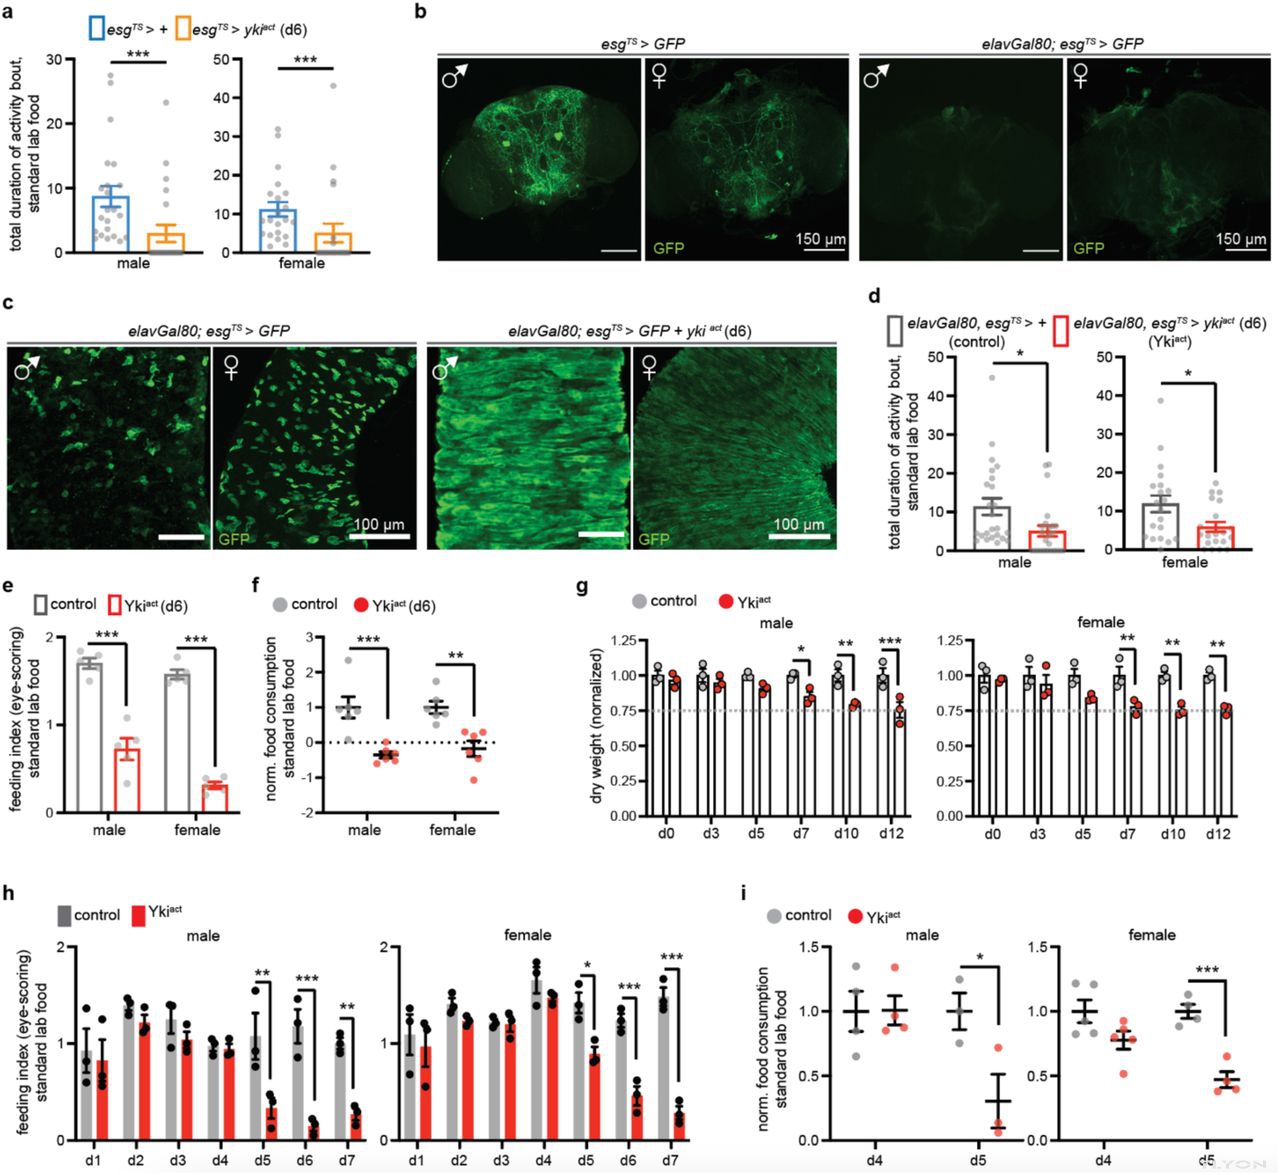
Figure 1:Colorectal-specific Yki-tumors (Ykiact) cause anorexia prior to organ wasting.
a. Flypad-based behavioral feeding assay with standard lab food. We tested control (esgTS>+, blue square) and flies with colorectal tumor (esgTS>ykiact, orange square) induced for 6 days. Graphs show the total duration of activity bout (total duration an individual fly touches the food, grey dot) in male (left) and female (right) flies. Male: n= 22 flies per genotype. Female: n=21 flies per genotype. p-values were obtained with Mann-Whitney test. b. Confocal images of male and female brains from flies with the escargot Gal4 driver conditionally expressing GFP (esgTS>GFP) and from flies co-expressing the neuronal elavGal80 inhibitor (elavGal80;esgTS>GFP) for 6 days. anti-GFP (green). scale bar: 150μm. c. Confocal images of guts in male and female of control (elavGal80;esgTS>GFP) and of flies with Yki activation in the gut for 6 days without expression in the brain (elavGal80;esgTS>GFP +ykiact). Anti-GFP: green. scale bar: 100μm. d. Flypad-based behavioral feeding assay with lab food. We tested control (elavGal80;esgTS>+, grey square) and flies with colorectal-specific Yki induction for 6 days without expression in the brain (elavGal80;esgTS>ykiact, referred hereafter as Ykiact, red square). Graphs show the total duration of activity bout (grey dot) in male (left) and female (right) flies. Male: n= 24 flies per genotype. Female: n=20 flies per genotype. p-values were obtained with Mann-Whitney test. e. Blue-dye based feeding assay testing lab food intake of control (elavGal80;esgTS>+, grey square) and Ykiact (elavGal80;esgTS>ykiact, red square) flies on d6. Graph shows the feeding index based on eye-scoring of males (left) and females (right) per genotype. n= 5 biological samples per genotype in male and female. p-values were obtained with two-way Anova using Sidak’s multiple comparisons test. f. Blue-dye based feeding assay testing the lab food intake of control (elavGal80;esgTS> +, grey circle) and Ykiact (elavGal80;esgTS>ykiact, red circle) flies on d6. Graph shows food consumption measured via color spectrophotometry of homogenized samples and normalized to control in male and female. n= 6 biological samples per genotype in male and female. p-values were obtained with two-way Anova using Sidak’s multiple comparisons test. g. Graphs show dry weight of control (elavGal80;esgTS>+, grey circle) and Ykiact (elavGal80;esgTS>ykiact, red circle) flies from d0 (no tumor induction) to d12 in male (left) and female (right). n= 3 biological samples per genotype per timepoint. Dry weight is normalized to control in male and female. p-values were obtained with two-way Anova using Sidak multiple comparisons test. h. Graphs show the feeding index from blue-dye eye-scoring assay comparing lab food intake of control (elavGal80;esgTS>+, grey) and Ykiact (elavGal80;esgTS>ykiact, red) flies from d1 to d7 in male (left) and female (right). n= 3 biological samples per genotype per timepoint. p-values were obtained with two-way Anova using Sidak’s multiple comparisons test. i. Graphs show food consumption measured via color spectrophotometry of control (elavGal80;esgTS>+, grey) and Ykiact (elavGal80;esgTS>ykiact, red) homogenized flies on d4 and d5 in male (left) and female (right). Values are normalized to control per timepoint. Male: n=4 biological samples per genotype on d4; n=3 biological samples per genotype on d5. Female: n=5 biological samples per genotype on d4; n=4 biological samples per genotype on d5. p-values were obtained with two-way Anova using Sidak’s multiple comparisons test. Each experiment was repeated 2-4 times. *: 0.05>p>0.01, **: 0.01<p<0.001, ***: p<0.001. Mean ± s.e.m.


